Bicycle Industry Overview 2015
More Recent Research & Studies:


2015 – The NBDA Bicycle Industry Statpak
A Look at the Bicycle Industry’s Vital Statistics
2015 was a stable year for the U.S. bicycle industry, with direct effect sales of $6.2 billion, including retail sales of bicycles, related parts and accessories, through all channels of distribution. This compares to $6.1 billion in sales in 2014. The source is the U.S. Bicycle Market 2014 report prepared for the NBDA by the Gluskin Townley Group.
The overall size of the industry has remained fairly stable since 2003, with sales between $5.8 billion and $6.1 billion each year (the exception being the recession year 2009). For comparison purposes, the industry’s size was projected at $5.3 billion in 2002, $5.4 billion in 2003, $5.8 billion in 2004, $6.1 billion in 2005, $5.8 billion in 2006, $6.0 billion in 2007, $6.0 billion in 2008, $5.6 billion in 2009, $6 billion in 2010, $6 billion in 2011, $6.1 billion in 2012, $5.8 billion in 2013, and $6.1 billion in 2014.
There has also been a trend toward more bicycle retailers selling used bicycles. In 2015, an estimated $1.2 billion in used bicycles were sold through all distribution channels, as well as private parties.
Bicycle unit sales (for all new bicycles, and for those with 20-in. wheels and above) for the U.S., including both the dealer and mass merchant channels are as follows. Please note that these figures reflect market consumption based on import statistics and estimates of domestic production. They do not account for inventory at the retail and wholesale levels.
| Year | Bicycles Sold (Millions) 20″ + wheels | Bicycles Sold (Millions), all wheel sizes |
|---|---|---|
| 2015 | 12.5* | 17.4* |
| 2014 | 12.4* | 18.0* |
| 2013 | 11.3* | 16.2* |
| 2012 | 13.0* | 18.7* |
| 2011 | 11.0* | 15.7* |
| 2010 | 13.5* | 19.8* |
| 2009 | 10.2* | 14.9* |
| 2008 | 13.4* | 18.5* |
| 2007 | 12.8* | 18.2* |
| 2006 | 12.7* | 18.2* |
| 2005 | 14.0* | 19.8* |
| 2004 | 13.0* | 18.3* |
| 2003 | 12.9* | 18.5* |
| 2002 | 13.6* | 19.5* |
| 2001 | 11.3* | 16.7* |
| 2000 | 11.9* | 20.9* |
| 1999 | 11.6* | 17.5* |
| 1998 | 11.1* | 15.8* |
| 1997 | 11.0* | 15.2* |
| 1996 | 10.9 | 15.4 |
| 1995 | 12 | 16.1 |
| 1994 | 12.5 | 16.7 |
| 1993 | 13 | 16.8 |
| 1992 | 11.6 | 15.3 |
| 1991 | 11.6 | |
| 1990 | 10.8 | |
| 1989 | 10.7 | |
| 1988 | 9.9 | |
| 1987 | 12.6 | |
| 1986 | 12.3 | |
| 1985 | 11.4 | |
| 1984 | 10.1 | |
| 1983 | 9 | |
| 1982 | 6.8 | |
| 1981 | 8.9 | |
| …1973 | 15.2 (record high) |
Source: Apparent market consumption based on U.S. Department of Commerce import statistics, and estimates of domestic market production by National Bicycle Dealers Association and Gluskin Townley Group, LLC.
* indicates projected figures
Distribution Channels
Bicycle sales are accomplished in this country through five primary and distinct channels of distribution — specialty bicycle retailers, mass merchants, full-line sporting goods stores, outdoor specialty stores, and “other,” which is comprised of a mixture of retailers (including Internet sales).
Department, discount and chain toy stores (mass merchants) sell mostly price-oriented products. Approximately 74% of bicycle units were sold through the mass merchant channel in 2015, representing 32% of the dollars at an average selling price of $89. The market share represents a slight increase from 2013, while the average selling price fell by a few dollars.
The approximately 4,000 specialty bicycle retailers commanded approximately 13% of the bicycle market in terms of unit sales in 2015, but 49% of the dollars, a dominant dollar share. Dealer price points generally start at around $200, with the average at $753, though prices can range into the thousands. While the number of specialty bicycle stores has declined in recent years due to consolidation, they are responsible for approximately the same amount of business through these fewer (but larger) stores today. It should be noted that new bicycle sales represent about 47% of the revenue for the average specialty bicycle retailer, with parts, accessories, service/repair, rentals and fitness equipment sales comprising the rest. Specialty bicycle retailers as a group feature quality merchandise, and add value through services such as bike fitting, assembly, repair, and community involvement.
Chain sporting goods stores sold approximately 6% of the bicycles in 2015, and 8% of the dollars, at an average price of $266. These are merchants that fall somewhere between mass merchant and bicycle dealers on the spectrum.
Outdoor specialty retailers sold approximately 3.5% of the bicycles in 2015, representing 8% of dollars and an average retail selling price of $464.
The “other” category sold 2% of the units, representing 3% of the dollars, with an average price of $247.
Recent History: Overview
The industry’s high point, in terms of unit sales, was the so-called “bike boom” in the 1970s. The boom ended suddenly when the industry reached a rapid saturation point and did not have breadth of product choices to sustain sales levels.
Today, the industry has a much stronger foundation and much greater variety, with an estimated 2,000 companies involved in manufacturing and distributing cycling products to retailers, and approximately 150 different bicycle brand names to choose from. A wider variety of product is being sold to a wider range of consumers than ever before. Since the “boom,” no part of the bicycle has remained unchanged, with fundamental improvements in design and materials being the norm throughout the industry.
Today’s quality bicycles are more comfortable than ever before, the components more function-specific and reliable, and new and exciting features are introduced regularly. This allows professional retailers many options to match the right bike to each consumer — male or female, big or little, frequent or infrequent rider, status-conscious or not.
The success story of the mountain bike has been the focus of much of the specialty industry in recent years, with mountain bikes representing about 25% of all bicycles sold in the year 2012 by specialty bicycle stores (represented in bicycle stores, not mass merchants). This figure has been relatively stable this decade, but down from the high point of approximately 60% in the boom years of the mid 1980s. Mountain bikes continue to be a major bicycle category for specialty bicycle stores. The decline may also be somewhat misleading, because the “comfort bike” category could actually be considered a subset of the mountain bike, and these bikes are comparable in many ways to low-end mountain bikes. “Comfort” bicycles look a lot like mountain bikes, but feature soft saddles, more upright seating position and easier gearing than the traditional mountain bike.
The next largest single bicycle category in 2012 at bike shops was hybrid bikes, followed by road bikes at 20%, according to the annual retail survey published by the NBDA. The unit sales trends by category are below.
Cycling Participation
36 million Americans age seven and older were estimated to have ridden a bicycle six times or more in 2015, according to the National Sporting Goods Association NSGA). This number was up slightly compared to the previous year. The peak participation year was 1995, with 56.3 million participants. It should be noted that the age limit on this number eliminates millions of young people who ride bicycles with wheel sizes 19″ and under. It also does not count those who rode a bicycle fewer than six times in the year. While the number of cyclists has declined since the peak, much of that is attributed to declining youth participation, and the overall trend for the last decade has been flat.
New research in 2015 from PeopleForBikes used a different methodology and parameters to assess cycling participation. By this measure, over 100 million people rode a bike at least once in 2014, ages 3 and above. This research projects higher participation numbers than the NSGA with its distinct definition, and can be accessed at PeopleForBikes.org.
Cycling is often cited as the seventh most popular recreational activity in the U.S., behind exercise walking, swimming, camping, fishing, exercising with equipment, and bowling. Though overall bicycle use has been flat, several studies have shown an increase in bicycle use for commuting and utility use.
However, bicycles and related products continue to appeal primarily to a recreation market in the United States. NBDA research conducted by the Bicycle Market Research Institute in 2006 reported that 73% of adult cyclists rode for recreation, 53% for fitness, 10% for commuting, 8% racing, and 6% sport. The figures add up to more than 100% because some ride in multiple ways. The number of people commuting by bicycle has grown significantly since that year, though this can be difficult to measure because many commuters may not consider themselves as “cyclists.”
Riding for transportation clearly establishes cycling as a legitimate part of the nation’s transportation mix. The industry, as well as cyclists across the country, have advocated for streets and roads to be made friendlier to bicyclists and pedestrians in recent years. Bicycles are important not only as vehicles to make an entire trip but as connectors for short trips from mass transit. Several cities and companies have instituted bike-sharing programs that allow people to rent a bike for transportation and return it later.
Cycling facilities construction has been strong in recent years, with both pedestrian and bicycle facilities receiving good support from the government including the excellent “Safe Routes to School” program. Better facilities continue to be an important factor in the industry’s projections for future growth, as cyclists seek safe and well-designed places to ride. Good infrastructure is vital so Americans can pursue a clean and healthy transportation alternative that is both practical and affordable. Bicycle use continues to be a potential solution for improving peoples’ health, reducing the use of fossil fuels for transportation, as well as contributing to more livable communities, at a very modest cost. More on the movement to help build cycling into the nation’s transportation infrastructure is available from PeopleForBikes.
Specialty Bicycle Sales By Year, Units, 2005-2012
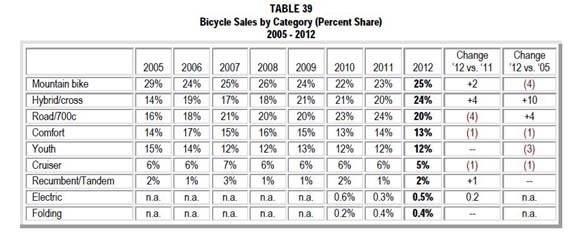
Source: U.S. Commerce Department statistics, Gluskin Townley Group estimates.
The Future
The outlook for the future in bicycles is positive, though stability has been the story of the recent past. The bicycle industry is a seasonal business that can be impacted by unusual weather, particularly late-arriving Spring weather. It is also an industry that relies on discretionary spending so it is seriously impacted by economic conditions. Overall, industry sales of bicycles seem to be stable at around 15 to 20 million bicycle units annually, plus parts, accessories and service, which historically is a very healthy number for the industry. National trends related to the green movement, environmental sustainability, the need to address health problems related to inactivity, and higher gas prices also bode well for the future of human-powered transportation.
The federal government has also budgeted significant transportation money for the construction of bicycle-specific facilities such as bike paths and road improvements friendly to bicycles in the coming years. This is another sign of the emergence of bicycling as a more visible, viable, and mainstream form of transportation. Making a more bicycle-friendly America is one of the industry’s key initiatives going forward. Even in tough times, governments at the federal, state, and local levels continue to include support for bicycles and pedestrians, and momentum seems to be building to support non-automotive modes of transportation as cities try to improve livability in order to attract employers and employees to bolster their economies.
New niche markets also exist and continue to have great potential, including electric-assist bicycles. Others to watch are recumbent bicycles, folding bicycles, and urban/utility bikes.
Imports and Domestic
The U.S. bicycle market is dominated by imported bicycles. In 2014 it is estimated more than 99% or 17.8 million bicycles were imported into the country, primarily from China and Taiwan.
There are several companies that operate in the mass merchant channel including — Dorel (Schwinn, Mongoose, Roadmaster), Dynacraft (Magna), Huffy Corp. (Royce Union), Rand and Kent. Virtually all of these bicycles are imported from China.
Kent International built a new bicycle manufacturing plant in South Carolina in 2014 to supply mass merchant retailers, with a capacity of approximately 500,000 units per year by 2016. Many are watching this carefully to see whether it may signal a shift toward more U.S. manufacturing in the future.
Companies specializing in bicycles for the independent bicycle dealer channel of trade include the so-called “Big Three” of Trek, Giant, and Specialized (in order of market share estimates). Other top players include Redline, Raleigh America, Haro, and Electra.
There is little brand crossover between these channels for most of the brands cited, though the Schwinn brand is now seen in both mass merchants and specialty stores with different models. Otherwise, it is uncommon to find brands from one channel being sold in stores from the other in any great numbers.
The domestic production of bicycles in the U.S. is estimated at approximately 200,000 units. Aside from the frame, significant bicycle content often includes imported components (drivetrains, wheels, tires, bars, saddles, etc.) from companies such as Shimano and SRAM. There are dozens of smaller U.S. bike makers — over 100 brands in all, so there is domestic manufacturing at some level.
With so many quality bicycles sold through the independent bicycle dealer channel of trade being imported, the U.S. bicycle dealer network — as well as consumers — rely heavily on free global trade for merchandise. Bicycle components, including drivetrains, derailleurs, and brakes, are frequently manufactured in the Far East, with Shimano being the largest manufacturer.
*Numerous sources were used for the above analysis, including figures from the United States International Trade Commission investigation, Bicycle Manufacturers Association, U.S. Department of Commerce Import Statistics, National Bicycle Dealers Association, and Jay Townley and Associates.
According to recent research from the NBDA (2011), the average specialty bicycle retailer had gross annual sales of $866,817 up from an average of $550,000 in 2005. The typical specialty bicycle retailer did business from a store about 5,000 square feet in size. 84% of them had one location, and 92.8% had no more than two locations.
The average bicycle dealer’s revenue was 47.4% bicycles, 35.5% parts and accessories, 10.7% bicycle repair, 0.8% bicycle rental, 1.9% fitness equipment, and 3.5% “other.” The average store sells approximately 650 bicycles per year, carries five bicycle brands (though not all in great depth), and numerous accessories brands. Recent trends are toward consolidation with retailers carrying fewer bicycle brands, sometimes at the urging of their suppliers who want more representation for their products. Gross margins on bicycles average about 37%, though the break-even point has been shown to be 38.6% for the average store (the average “cost of doing business”). Margins on hardgoods are generally higher than those for bicycles (48% gross margin).
The specialty bicycle retail channel has faced consolidation in recent years, as the chart courtesy of The Bike Shop List illustrates. Fierce competition and tight profit margins continue to be challenges for bicycle retailers. While the number of physical stores has clearly declined, specialty bicycle retailers still sold approximately 3 million bicycles in 2014 — a historically healthy number. This leads to the conclusion that the stores are becoming larger on average, with similar sales volume through fewer stores. Still, given the importance of physical bike shops to American cyclists, the decline is troubling. Without healthy and vibrant local sources for bike products, service and repair, growth in cycling participation will be difficult to achieve.
| Year | Specialty Bicycle Locations |
|---|---|
| 2000 | 6,195 |
| 2001 | 6,259 |
| 2002 | 5,505 |
| 2003 | 5,358 |
| 2004 | 4,982 |
| 2005 | 4,704 |
| 2006 | 4,600 |
| 2007 | 4,451 |
| 2008 | 4,349 |
| 2009 | 4,319 |
| 2010 | 4,256 |
| 2011 | 4,178 |
| 2012 | 4,089 |
| 2013 | 4,055 |
| 2014 | 3,950 |
| 2015 | 3,790 |
Sources
Some other sources of information on the bicycle industry are: Trade Magazines
Bicycle Retailer & Industry News
Outspokin’ Newsletter & Blog published by the National Bicycle Dealers Association.
Consultants
Coffrin Group, Gary Coffrin; 408-225-1040 (Business consulting and services, market research)
Gluskin Townley Group, Jay Townley, 608-666-2062.
International Cycle Works, Thomas Prehn; 303-473-0007.
Interskill, Thomas Franges; 415-455-9735.
The Mann Group, Dan Mann; 828-645-0974; www.manngroup.net
Directories & Mailing Lists
The Bike Shop List, N1367 Southern Rd., Lyndon Station, WI 53944-9708, phone 608-666-2062, contact Jay Townley (database of bicycle retailers).
Bicycle Retailer and Industry News Directory, 25431 Cabot Rd., Suite 201, Laguna Hills, CA 92653, phone 949-206-1677. (Directory of manufacturers/distributors).
Trade Winds Taiwan Bicycle Guide Online. A web site that introduces buyers to Taiwan’s bicycles, parts and accessories through a searchable database of cycle products and suppliers. This is the online version of the annual Taiwan Bicycles & Parts Buyers Guide. http://www.bicycle-guide.com
Research
Bicycle Product Suppliers Association, (Tracks wholesale shipments of bicycles to bicycle dealers and represents bicycle product suppliers).
Gluskin-Townley Group (market research firm):
Elliot Gluskin
3932 Longfellow Street
Allentown, PA 18104
Phone: 610-481-9088
E-mail: elliot@gluskintownley.com
Jay Townley
N1377 Southern Rd.
Lyndon Station, WI 53944
Phone: 608-666-2062
E-mail: jay@gluskintownleygroup.com
Leisure Trends Group / NPD, 1680 38th St. #110, Boulder, CO 80301; 303-786-7900
National Bicycle Dealers Association (NBDA), 3972 Barranca Pkwy Ste J-423, Irvine, CA 92606; Phone 949-540-8020; E-mail info@nbda.com;
PeopleForBikes, P.O. Box 2359, Boulder, CO 80306; 303-449-4893 (Works to support bicycle advocacy and construction of bicycle-friendly facilities).
Associations and Advocacy
Adventure Cycling Association, P.O. Box 8308, Missoula, MT 59807; 406-721-1776 (Non-profit service organization for recreational and touring cyclists).
Alliance for Biking and Walking, P.O. Box 65150, Washington, DC 20035; 202-449-9692,
(Advancing bicycling and walking through unified state and local bicycle advocacy organizations).
Bicycle Product Suppliers Association (See above – Represents wholesalers to the bicycle dealer channel of trade).
International Mountain Bicycling Association, P.O. Box 7578, Boulder, CO 80306; 303-545-9011 (Dedicated to responsible mountain bike use, access to public lands).
League of American Bicyclists, 1612 K St., NW, Ste. 401, Washington, DC 20006; 202-822-1333 (Consumer cycling organization, includes advocacy).
National Bicycle Dealers Association (NBDA) (See above – Represents bicycle dealer channel of trade).
National Center for Bicycling and Walking, 1506 21st St. NW, Ste. 200, Washington, DC 20036; 202-463-6622 (Bicycle and pedestrian advocacy).
This Statpak is provided as a public and industry service by the National Bicycle Dealers Association. Permission is granted for use of the information, as long as the NBDA is cited as the source.
![]() The NBDA has been here since 1946, representing and empowering specialty bicycle dealers in the United States through education, communications, research, advocacy, member discount programs, and promotional opportunities. As shops are facing never-before-seen circumstances, these resources offer a lifeline. Together, we will weather this. We at the NBDA will not waver in our commitment to serving our members even during this challenging time—but we need your support.
The NBDA has been here since 1946, representing and empowering specialty bicycle dealers in the United States through education, communications, research, advocacy, member discount programs, and promotional opportunities. As shops are facing never-before-seen circumstances, these resources offer a lifeline. Together, we will weather this. We at the NBDA will not waver in our commitment to serving our members even during this challenging time—but we need your support.
Now is the time to become a member as we join together to make one another stronger. Whether you’re a retailer or an industry partner, your membership in the NBDA is one of the best investments you’ll make this year.
Learn more about the benefits of being a member and join now.